The method of evaluation will depend on whether it is a classification or regression model.
- In the case of classification, the common evaluation methods are the confusion matrix, classification report, and accuracy score.
- Confusion Matrix
- Classification Report
Classification Report
- Parameters
• y_true: 1d array-like, or label indicator array / sparse matrix
Ground truth (correct) target values.
• y_pred: 1d array-like, or label indicator array / sparse matrix
Estimated targets as returned by a classifier.
• Labels: array-like of shape (n_labels,), default=None
Optional list of label indices to include in the report.
• target_names: list of str of shape (n_labels,), default=None
Optional display names matching the labels (same order).
• sample_weight: array-like of shape (n_samples,), default=None
Sample weights.
• digits: int, default=2
Number of digits for formatting output floating point values. When output_dict is True, this will be ignored and the returned values will not be rounded.
• output_dict: bool, default=False
If True, return output as dict.
- Returns
• report: string / dict
Text summary of the precision, recall, F1 score for each class.
Dictionary returned if output_dict is True.
Dictionary has the following structure:
{'label 1': {'precision':0.5,
	'recall':1.0,
	'f1-score':0.67,
	'support':1},
'label 2': { ... },
 ...
}
• report: string / dict
The reported averages include macro average (averaging the unweighted mean per label), weighted average (averaging the support-weighted mean per label), and sample average (only for multilabel classification). Micro average (averaging the total true positives, false negatives and false positives) is only shown for multi-label or multi-class with a subset of classes, because it corresponds to accuracy otherwise and would be the same for all metrics.
Note that in binary classification, recall of the positive class is also known as “sensitivity”; recall of the negative class is “specificity”.
precision, recall, F1 score

precision(정밀도)란 모델이 True라고 분류한 것 중에서 실제 True인 것의 비율이다.

recall(재현율)이란 실제 True인 것 중에서 모델이 True라고 예측한 것의 비율이다.

F1 score은 Precision과 Recall의 조화평균이다.

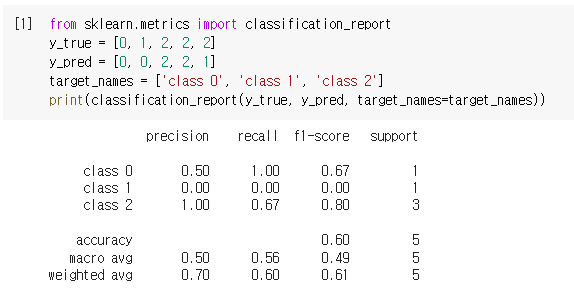
Classification Report Example #1
from sklearn.metrics import classification_report
y_true = [0, 1, 2, 2, 2]
y_pred = [0, 0, 2, 2, 1]
target_names = ['class 0', 'class 1', 'class 2']
print(classification_report(y_true, y_pred, target_names=target_names))
class 0의 precision은 모델이 True라고 분류한 것(1+1+0=2) 중에서 실제 True인 것(True0 Pred0 =1)의 비율 1/2=0.50이다.
class 1의 precision은 모델이 True라고 분류한 것(0+0+1=1) 중에서 실제 True인 것(True1 Pred1 =0)의 비율 0/1=0.00이다.
class 2의 precision은 모델이 True라고 분류한 것(0+0+2=2) 중에서 실제 True인 것(True2 Pred2 =2)의 비율 2/2=1.00이다.
class 0의 recall은 실제 True인 것(1+0+0=1) 중에서 모델이 True라고 예측한 것(True0 Pred0 =1)의 비율 1/1=1.00이다.
class 1의 recall은 실제 True인 것(1+0+0=1) 중에서 모델이 True라고 예측한 것(True1 Pred1 =0)의 비율 0/1=0.00이다.
class 2의 recall은 실제 True인 것(0+1+2=3) 중에서 모델이 True라고 예측한 것(True2 Pred2 =2)의 비율 2/3=0.67이다.
class 0의 f1-score은 2*(precision*recall)/(precision+recall) = 2*(0.50*1.00)/(0.50+1.00)=0.67이다.
class 1의 f1-score은 2*(precision*recall)/(precision+recall) = 2*(0.00*0.00)/(0.00+0.00)=0.00이다.
class 2의 f1-score은 2*(precision*recall)/(precision+recall) = 2*(1.00*0.67)/(1.00+0.67)=0.80이다.
accuracy(정확도)는 전체 5 중에 정확히 예측한 값(1+0+2=3) 3/5=0.60이다.
Classification Report Example #2
y_pred = [1, 1, 0]
y_true = [1, 1, 1]
print(classification_report(y_true, y_pred, labels=[0, 1]))
https://github.com/erica00j/machinelearning/blob/main/classification_report.ipynb
GitHub - erica00j/machinelearning
Contribute to erica00j/machinelearning development by creating an account on GitHub.
github.com
'인공지능 > Machine Learning' 카테고리의 다른 글
| [ML] Linear Regression (선형 회귀) 예제 (0) | 2022.10.18 |
|---|---|
| [ML] Linear Regression (선형 회귀) (0) | 2022.10.18 |
| [ML] Evaluation / Confusion Matrix (0) | 2022.10.17 |
| [ML] Split-Validation / Machine Learning Model Design (0) | 2022.10.17 |
| [ML] K-means clustering 실습 예제 2 (0) | 2022.10.14 |


댓글